Announcing Benchmarking with Juju
Adam Israel
on 25 June 2015

Benchmarking and performance are interesting problems, especially in today’s growing cloud-based microservice scene. It used to be a question of “how does this hardware compare to that hardware,” but as computing and service-oriented architectures grow the question has evolved. How does my cloud and application stack handle this? It’s no longer enough to run PTS on your web server and call it a day.
Measuring every microservice in your stack, from backend to frontend, is a complex task. We started thinking about how you would model a system to benchmark all of these services. It’s not just a matter of measuring the performance of one service, but also its interactions with other services. Now multiply that by every config option for every service, like PostgreSQL, which has hundreds of options that can affect performance.
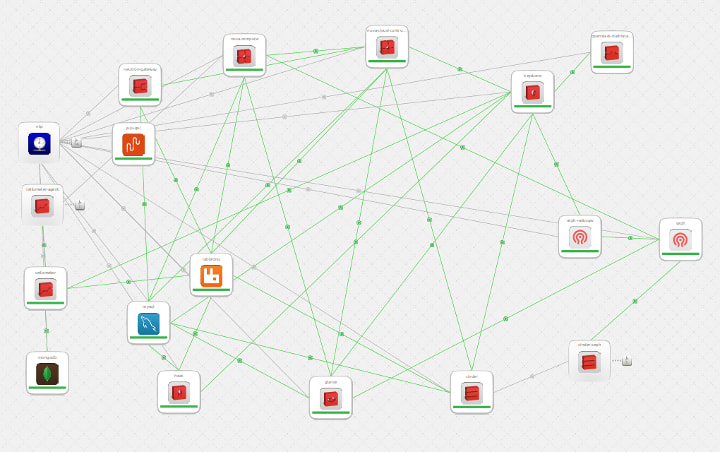
Juju has been modeling service orchestration since 2010. It’s done a great job of taking complex scenarios that are now booming, such as containerization, service oriented architectures and hyperscale, and condensing those ideas down into composable, reusable, pieces. Today we’re adding benchmarking. The ability not just to define the relationships between these services, but how they should be measured in relation to each other.
As an example, monitoring the effect of adjusting the cache in nginx is a solved problem. What we’re going after is what happens when you adjust any service in your stack in relation to every other service. Turn every knob programmatically and measure it at any scale, on any cloud. Where exactly will you get the best performance: your application, the cache layer, or the backend database? Which configuration of that database stack is most performant? Which microservice benefits from faster disk I/O? These are the kinds of questions we want answered.
With Juju Actions, we can now encapsulate tasks to run against a single unit or service in a repeatable, reliable, and composable way. Benchmarking is a natural extension of Actions, allowing authors to encapsulate the best practices for measuring the performance of a service and serve those results — in a standard way — that any user or tool can digest.
We’re announcing charm-benchmark, a library written in Python that includes bash scripts so you can write benchmarks in any language. It uses action-set under the covers to create a simple schema that anyone can use and parse.
While we may intimately know a few services, we’re by no means the experts. We’ve created benchmarks for some of popular services in the charm store, such as mongodb, cassandra, mysql and siege, in order to provide a basic set of examples. Now we’re looking for community experts who are interested in benchmarking in order to fill the gap of knowledge. We’re excited about performance and how Juju can be used to model performance validation. We need more expertise on how to stress a service or workload to measure that performance.
For example, here’s what a benchmark for siege would look like:
actions.yaml:
siege:
  description: Standard siege benchmark.
  params:
    concurrent:
      description: The number of simultaneous users to stress the web server with.
      type: integer
      default: 25
    time:
      description: The time to run the siege test for.
      type: string
      default: "1M"
    delay:
      description: |
        Delay each simulated user for a random number of seconds between
        one and DELAY seconds.
      type: integer
      default: 3
actions/siege:
#!/bin/bash
set -eux

# Make sure charm-benchmark is installed
if ! hash benchmark-start 2&>/dev/null; then
    apt-get install -y python-pip
    pip install -U charm-benchmark
fi

runtime=`action-get time`
concurrency=`action-get concurrency`
delay=`action-get delay`
run=`date +%s`

mkdir -p /opt/siege/results/$run

benchmark-start

# Run your benchmark
siege -R $CHARM_DIR/.siegerc -t ${runtime:-1M} -c ${concurrency:-25} -d ${delay:-3} -q --log=/opt/siege/results/$run/siege.log

# Grep/awk/parse the results

benchmark-data transactions $transactions hits desc
benchmark-data transaction_rate $hits “hits/sec” desc
benchmark-data transferred $transferred MB desc
benchmark-data response_time $response ms asc

# Set the composite, which is the single most important score
benchmark-composite transaction_rate $hits hits/sec desc

benchmark-finish || true
We’ll be covering benchmarking in the next Juju Office Hours on July 9th at 1600 EDT/20:00 UTC and we’d love to help anyone who wants to get started, you can find me, Adam Israel (aisrael), Marco Ceppi (marcoceppi), and Tim Van Steenburgh (tvansteenburgh) on #juju on Freenode and on the Juju mailing list.
Smart operations, optimal architecture, better pricing.
OpenStack and Ubuntu bring automated deployment and management that help you optimize infrastructure costs — no matter your industry or use case.
Newsletter signup
Related posts
Supporting more identity providers on Ubuntu with the new Authd OIDC broker
Today we are announcing the general availability of the new generic OpenID Connect (OIDC) broker for Authd. With enterprises needing to centralise access...
SpacemiT announces the availability of Ubuntu on K3/K1 series RISC-V AI computing platforms
SpacemiT (Hangzhou) Technology Co., Ltd. today announced a collaboration with Canonical to make Ubuntu available on SpacemiT’s new K3 SoC and the existing...
AI meets SQL Server 2025 on Ubuntu
Partnership between Microsoft and Canonical Since 2016, when Microsoft announced its intention to make Linux a first class citizen in its ecosystem, Canonical...
